Oracle Enterprise Manager alternative: the complete guide
If you're searching for an Oracle Enterprise Manager alternative, you're probably not tired of monitoring — you're tired of what OEM demands in exchange: a platform to operate, agents to deploy, and a per-core Diagnostic Pack bill for the screens you actually open. This guide covers what OEM really costs, what to demand from a replacement, every realistic option (including the free ones), and how to be monitoring your fleet this afternoon.
V$/DBA_ views does it with no agents, no platform and no packs, for less than a single month of the Diagnostic Pack. That's what Rarexa is. For patching, provisioning and deep AWR forensics across hundreds of targets, OEM still earns its keep — and we'll tell you exactly when to stay with it.Why DBAs look for an OEM alternative
Oracle Enterprise Manager (Cloud Control) is genuinely capable software. Nobody leaves it because it can't do things — they leave it because of what it takes to keep it doing them. Three complaints come up in almost every conversation:
1. It's infrastructure, not a tool
A working OEM deployment means an Oracle Management Server, a repository database, an agent on every monitored host, certificates, upgrades, and someone who owns all of it. For a large estate with a tools team, fine. For a DBA with eight production databases and no spare headcount, you've just adopted another production system whose only job is to watch your production systems.
2. The license gate
The screens most people open OEM for — the performance page, the activity graph, AWR reports, ADDM findings — legally require the Diagnostic Pack, licensed per processor on top of your database licenses. Want SQL Tuning Advisor? That's the Tuning Pack, also per processor. The features are physically present in Enterprise Edition, which makes them dangerously easy to use unlicensed — and Oracle's audit scripts check DBA_FEATURE_USAGE_STATISTICS for exactly that.
3. It's overkill for the daily question
Watch what a DBA actually does in OEM on a normal day: glance at target status, check a tablespace, confirm last night's backup ran, look at who's blocking. That's a read-only health check — and it's buried in a management platform with hundreds of menus. The daily question deserves a one-screen answer.
What OEM really costs (the honest math)
OEM itself is included with the database. The cost hides in the packs and the operation:
-- Example: one 2-socket x86 server, 16 cores per socket
cores            = 2 x 16 = 32
core factor      = 0.5 (x86)
licensable procs = 16

Diagnostic Pack list  = 16 x $7,500  = $120,000  (one-time)
Annual support (~22%) = 16 x $1,650  = $26,400 / year
Tuning Pack           = similar again, if you want the advisors
Those are long-published list prices — real contracts get discounts, but the shape holds: the bill scales with your hardware, not your usage. Add the soft costs: the OMS server, the repository database (and its backups, and its patching), agent maintenance on every host, and the upgrade projects every couple of years. We break the licensing down further in How much does the Diagnostic Pack really cost?
What to demand from an alternative
Before comparing products, write down what a replacement must do. After a decade of running Oracle in production, this is my checklist:
- Read-only, provably. The tool should connect with
CREATE SESSION+SELECT_CATALOG_ROLEand nothing more. If it wants write privileges, walk away. - No agents. Every agent is software you now patch on every host. SQL*Net is already there — use it.
- Pack-free by design. It must read only always-licensed views (
V$SESSION,V$SYSSTAT,DBA_TABLESPACES,V$RMAN_BACKUP_JOB_DETAILS…) and never touchDBA_HIST_*/ASH — or your monitoring tool becomes an audit finding. - The seven essentials on one screen: health status, sessions & blocking, storage with capacity forecasting, memory, wait events, Top SQL, and backup freshness.
- Fleet-first. One pane for all databases, not one browser tab per instance.
- Alerting that finds you (email, chat) — a dashboard nobody watches is wall art.
- On-premise. Your V$ data describes your business load. It shouldn't leave your network.
- A price you can approve without a committee.
Your four options, honestly compared
Option 1 — Homegrown SQL scripts (free)
Everything OEM shows comes from dictionary views you can query yourself. A folder of scripts plus DBMS_SCHEDULER or cron genuinely works — we publish the exact SQL in our tablespace guide and days-to-full guide. The catch is everything around the SQL: the UI, the history, the thresholds, the multi-database rollup, and the maintenance forever. Most teams that go this route spend years rebuilding a worse monitoring product one script at a time. Best for: one or two databases, tight budget, and time to spare.
Option 2 — General observability stacks (free software, real project)
Prometheus + an Oracle exporter + Grafana, or Zabbix with its Oracle templates, can absolutely monitor Oracle — and if you already run that stack for the rest of your infrastructure, extending it is reasonable. But these tools don't know what a tablespace, an RMAN job or a wait event means; you encode that Oracle knowledge yourself, dashboard by dashboard, alert rule by alert rule. Also check your exporter carefully: some query pack-gated views by default. Best for: platform teams standardizing on one observability stack, with time to build the Oracle layer.
Option 3 — Commercial database monitoring suites
Quest Foglight, SolarWinds DPA, dbWatch and similar are capable, cross-platform (Oracle + SQL Server + PostgreSQL…) and come with real vendor support. They're also priced per instance for larger estates, and several lean on pack-gated data for their deepest features — ask the vendor directly. Best for: heterogeneous estates with budget, where cross-database consistency matters more than lightness.
Option 4 — A focused, read-only Oracle health dashboard
The gap the other three leave open: a tool that knows Oracle deeply, installs in minutes, needs no agents, stays pack-free by design, and answers the daily question on one screen. That's the category Rarexa was built for — so let's be specific about what you get.
The commercial alternatives, profiled
If option 3 is where you're leaning, these are the names you'll shortlist most often. We compete with them, so read this knowing the source — but every claim here is the kind you can verify on the vendor's own site, and each profile links to a fuller comparison.
SolarWinds Database Performance Analyzer (DPA)
DPA's signature is wait-time analytics: it samples what sessions are waiting on, around the clock, and builds a historical picture of where response time goes. It's genuinely good at answering "why was the database slow on Tuesday at 3 p.m.?" — a tuning question more than a health question. It's cross-platform (Oracle, SQL Server, MySQL, PostgreSQL and more), agentless toward the targets, and runs on a central server with its own repository database. Licensing is per monitored instance, quote-based, aimed at enterprise budgets. If your pain is performance forensics across mixed database platforms, DPA deserves a look; if your pain is everyday fleet health, it's more machinery than the job needs. Full comparison: Rarexa vs SolarWinds DPA →
Quest Foglight for Databases
Foglight is the closest thing to "OEM but multi-vendor": a full monitoring platform — management server, repository, cartridges per technology — that covers databases, virtualization and infrastructure in one console. Its Performance Investigator does deep workload analysis, change tracking, and comparisons over time. The trade-offs mirror OEM's: real infrastructure to operate, enterprise quote-based pricing, and a scope far beyond database health. Shops consolidating monitoring for everything into one enterprise console pick Foglight; shops that just want their Oracle fleet visible do not. Full comparison: Rarexa vs Quest Foglight →
dbWatch Control Center
dbWatch focuses on large fleets — hundreds of instances across SQL Server, Oracle, PostgreSQL and MySQL — with per-instance licensing and a mix of monitoring plus routine management jobs. It's a serious tool for managed-service providers and big internal estates. For a team with five to fifty Oracle databases, its farm-scale features (and the console that comes with them) are usually more than the problem requires.
Rarexa: the focused alternative, in depth
Rarexa Oracle Health Dashboard is a single lightweight application (Windows or Linux) that connects to your databases over SQL*Net with a read-only user and gives you:
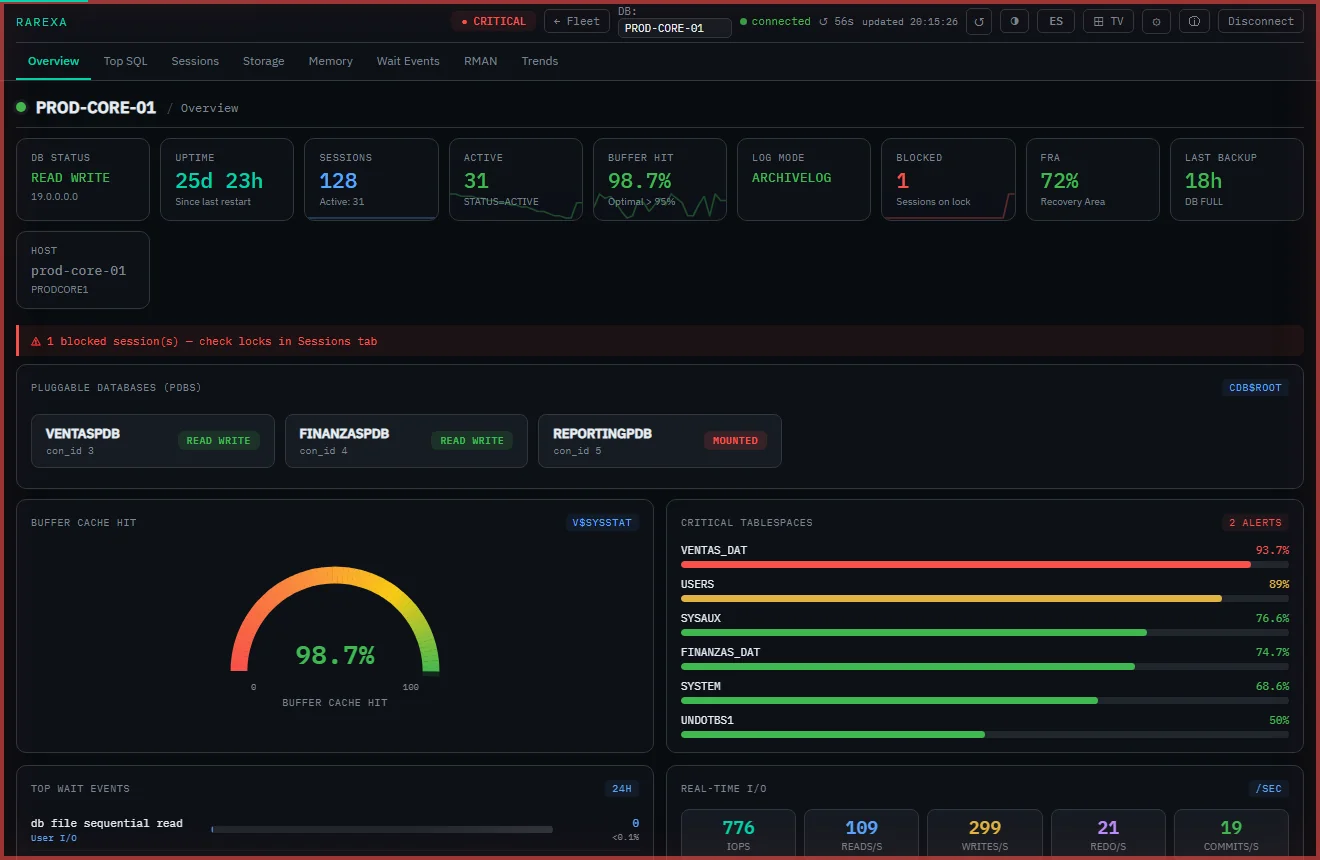
- Fleet view — every database as a card with live health (NORMAL / WARNING / CRITICAL / DOWN), sessions, buffer hit and worst tablespace. Click any card for the deep dive.
- Sessions & blocking — active sessions, who's blocked, and the lock chain that explains why.
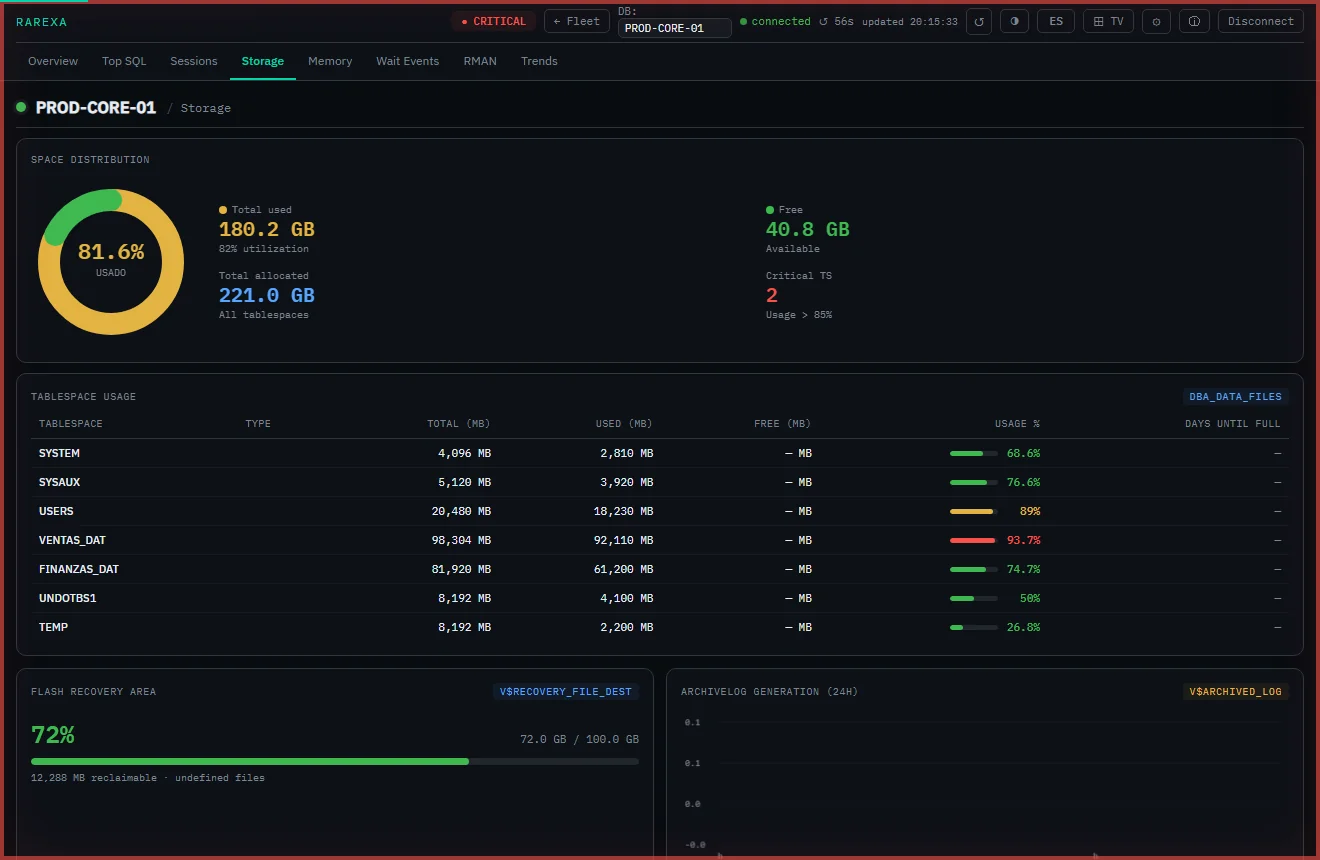
- Storage intelligence — per-tablespace usage measured against the autoextend ceiling, FRA usage, and days-to-full forecast computed from real growth history.
- Memory — SGA components and PGA at a glance.
- Wait events & Top SQL — where time goes and which statements cost the most, from V$ views only.
- RMAN freshness — last jobs, status, duration and size; an alert when a backup fails or falls behind.
- Alerts — email and Telegram, with per-database thresholds; secrets encrypted at rest.
- TV / NOC mode — auto-rotating wall display across your fleet, no keyboard needed.
- Bilingual UI (English/Spanish) and full PDF documentation.
If you live in OEM today: where things moved
The fastest way to evaluate a replacement is to map your daily clicks. Here's the translation table:
| What you check in OEM | Where it lives in Rarexa |
|---|---|
| Targets page / availability | Fleet view — one card per database with live health |
| Performance home (activity) | Overview tab — sessions, waits, real-time I/O (pack-free) |
| Blocking sessions | Sessions tab — blockers and the lock chain |
| Tablespace usage / alerts | Storage tab — usage vs autoextend ceiling + days-to-full |
| Top SQL (pack-gated) | Top SQL tab — from V$SQL, no pack required |
| Memory advisors' current view | Memory tab — SGA components, PGA, hit ratios |
| RMAN backup reports | RMAN tab — last jobs, status, duration, freshness alert |
| Metric thresholds & notifications | Settings — per-database thresholds, email/Telegram |
| AWR / ADDM / ASH forensics | Not replaced — that's tuning territory; keep OEM + packs if you need it |
What it costs
| Edition | Price | Databases | For |
|---|---|---|---|
| Desktop | $390/yr | Up to 3 | Individual DBA or consultant |
| Team | $990/yr | Up to 10 | A small team |
| Server | $2,900/yr | Up to 25 | A team's production fleet |
| Enterprise | from $4,900/yr | Unlimited | Multiple servers/sites, SLA |
Flat, annual, per machine — updates and support included, offline activation by Machine ID, 15-day full trial with no credit card. Full details on the pricing page.
Rarexa vs Enterprise Manager, side by side
| Rarexa OHD | Oracle Enterprise Manager | |
|---|---|---|
| Primary purpose | Read-only health monitoring | Full management platform |
| Setup time | Minutes — one installer | Days — OMS, repository, agents |
| Agents on targets | None | One per host |
| Changes your database? | Never | Yes (patch, provision, tune) |
| Diagnostic/Tuning Pack | Not required | Required for perf pages |
| Pricing model | Flat annual per machine | Per-core packs |
| Fleet / NOC TV mode | Built-in | Heavier to set up |
| Days-to-full forecasting | Built-in | Pack-gated (AWR) |
| Patching & provisioning | No | Yes |
| Deep AWR/ADDM forensics | No | Yes (with packs) |
| Best for | A few to a few dozen DBs | Large estates with a tools team |
Longer discussion with the reasoning behind each row: Rarexa vs Oracle Enterprise Manager.
Footprint & performance
Monitoring shouldn't be a workload. Rarexa is a single native binary (no Java stack, no application server, no repository database to feed). It polls each database on a 60-second cycle with lightweight SELECTs against in-memory V$ views — the same queries a careful DBA runs by hand, just on schedule. History is kept in an embedded local store, rolled up and purged automatically. The practical result: you can run it on a modest VM or an existing utility server, and your databases barely notice they're being watched.
Security & architecture
Replacing a monitoring platform means giving something new access to production — so the architecture deserves scrutiny. Here's how Rarexa is built, in the terms a security review will ask about:
- Least-privilege by contract. The connection user needs
CREATE SESSION+SELECT_CATALOG_ROLE— nothing else, ever. If your policy is stricter, the manual ships explicit per-view GRANTs (the exact statements). - No agents, no inbound ports on the database hosts. Rarexa connects out over SQL*Net like any client. Your DB servers run nothing new.
- Credentials encrypted at rest. Database passwords and alert secrets (SMTP/Telegram) are stored encrypted, not in plain-text config files.
- Optional authentication with roles on the dashboard itself, plus rate limiting and secure session cookies; bind it to your internal network, or front it with your reverse proxy for TLS.
- Fully on-premise, zero telemetry. Nothing is sent to Rarexa or any third party — your V$ data describes your business load, and it stays in your network. Licensing activates offline by Machine ID for the same reason.
- Small attack surface. One native binary, one embedded local datastore. No Java application server, no repository database, no agent fleet to patch — every component you don't deploy is a component you don't have to secure.
Installation: from download to live data
- Create the monitoring user (once per database — the manual ships the exact statements):
CREATE USER dbmon IDENTIFIED BY "<strong-password>"; GRANT CREATE SESSION, SELECT_CATALOG_ROLE TO dbmon; - Install Rarexa — Windows: portable .exe, one-click installer (runs as a service) or MSI for GPO. Linux: Docker image or systemd binary. Pick one on the downloads page.
- Open the dashboard in your browser — the 15-day trial starts automatically, no key needed.
- Register your databases — host, port, service name, the read-only user. The fleet view lights up as each one connects.
- Set alerts — SMTP or Telegram, tune thresholds per database, and put the TV mode on the NOC screen.
Realistic total for a first database: about 15 minutes. For a fleet of ten: an afternoon, most of it waiting for your security team to approve the GRANTs.
Use cases
The solo DBA or consultant
You manage a handful of production databases across one or several clients. OEM is a platform you'd have to babysit; Rarexa Desktop ($390/yr, up to 3 databases) runs on your workstation and answers the morning check in seconds.
The team with a production fleet
Fifteen databases, three DBAs, no tools team. Rarexa Server as a Windows service or systemd daemon becomes the shared source of truth: fleet view for everyone, per-database thresholds, alerts to the team channel, history for capacity planning.
The NOC wall
TV mode rotates through fleet and detail views on a configurable interval — status visible from across the room, no one touching a keyboard. This alone is why several customers bought it.
Coexisting with OEM
Plenty of shops keep OEM for patching and quarterly tuning work, and run Rarexa for everyday visibility. Since Rarexa is read-only and agent-less, there's nothing to conflict — it's an extra pair of eyes, not a rival platform.
Migrating from OEM: a practical checklist
A monitoring migration doesn't need a project plan — but it does need a sequence. This is the one I use; for a ten-database fleet it fits in a week of part-time attention, with the only real waiting being security approvals.
- Inventory what you actually use. Pull up OEM and be honest: which screens did anyone open in the last 90 days? Almost always it's availability, tablespaces, blocking, backups, and the performance page. Write the list — it's your acceptance criteria.
- Split monitoring from management. Mark anything on that list that changes databases (patching plans, provisioning, compliance jobs). If that set is empty, you can retire OEM entirely at the end of this checklist. If not, OEM stays for those jobs and this migration only moves the watching.
- Create the read-only user on every target. Two GRANTs per database (script it across the fleet). This is usually the step that waits on a security ticket — start it first.
- Install Rarexa and register the fleet. One machine, one installer, then add each database: host, port, service name, the monitoring user. No agents means no change tickets for the database hosts.
- Recreate your thresholds. Port the alert levels you actually tuned in OEM (tablespace %, blocked sessions, backup age) into Rarexa's per-database thresholds. Resist copying defaults you always ignored — a migration is a rare chance to delete alert noise.
- Point alerts at the team. SMTP or Telegram, and send a test. An unwatched dashboard is wall art; the alerts are the product.
- Run both side by side for two to four weeks. Every incident in that window, check: did Rarexa show it? This is where trust is earned — and where you find the one threshold you forgot.
- Decommission deliberately. If step 2 said "monitoring only": remove OEM agents from the targets, retire the OMS and repository, and reclaim the pack licenses at your next true-up — that last line is where the money is. If OEM stays for management, at minimum stop paying for what the packs were only doing for monitoring.
When you should stay on OEM
Honesty over marketing: keep Enterprise Manager if you need fleet-wide patching and provisioning automation, configuration compliance across hundreds of targets, or your team lives in AWR/ADDM forensics and already licenses the packs. Those are management jobs, and no lightweight monitor replaces them. Full analysis: Oracle Enterprise Manager alternatives in 2026.
Frequently asked questions
What is the best alternative to Oracle Enterprise Manager?
Is there a free alternative to Oracle Enterprise Manager?
Do Oracle monitoring tools require the Diagnostic Pack?
Can Rarexa completely replace Oracle Enterprise Manager?
How much does Oracle Enterprise Manager cost?
Does Rarexa work with Oracle Standard Edition and XE?
How long does it take to switch from OEM to Rarexa?
Can Rarexa and Enterprise Manager run side by side?
Try the alternative — free for 15 days
The trial is the full product. Download it, connect a database in 15 minutes, and see your fleet on one screen.
Download the free trial