The best Oracle monitoring tools in 2026
Most "best tools" lists are written by people who've never carried a pager. This one is organized the way a DBA actually decides: by the job you're hiring the tool for — because the best performance-forensics suite is a terrible answer to "is everything OK?", and vice versa. Eight tools, their real trade-offs, and where each one is the wrong choice.
The quick answer, by job
| Your job | Best fit | Pricing model |
|---|---|---|
| Everyday fleet health, fast & light | Rarexa | Flat $390–$2,900/yr, public |
| Manage + monitor a large estate | Oracle Enterprise Manager | Free, but packs per core |
| Performance forensics ("why slow?") | SolarWinds DPA | Per instance, quotes |
| Enterprise multi-domain console | Quest Foglight | Per instance, quotes |
| Hundreds of instances / MSP farms | dbWatch | Per instance, tiered |
| Free, DIY, you own the stack | Prometheus + Grafana / Zabbix | Free (your time) |
| Cloud-native, SaaS everything | Datadog DBM | Per host, monthly SaaS |
1. Rarexa Oracle Health Dashboard — best for everyday fleet health
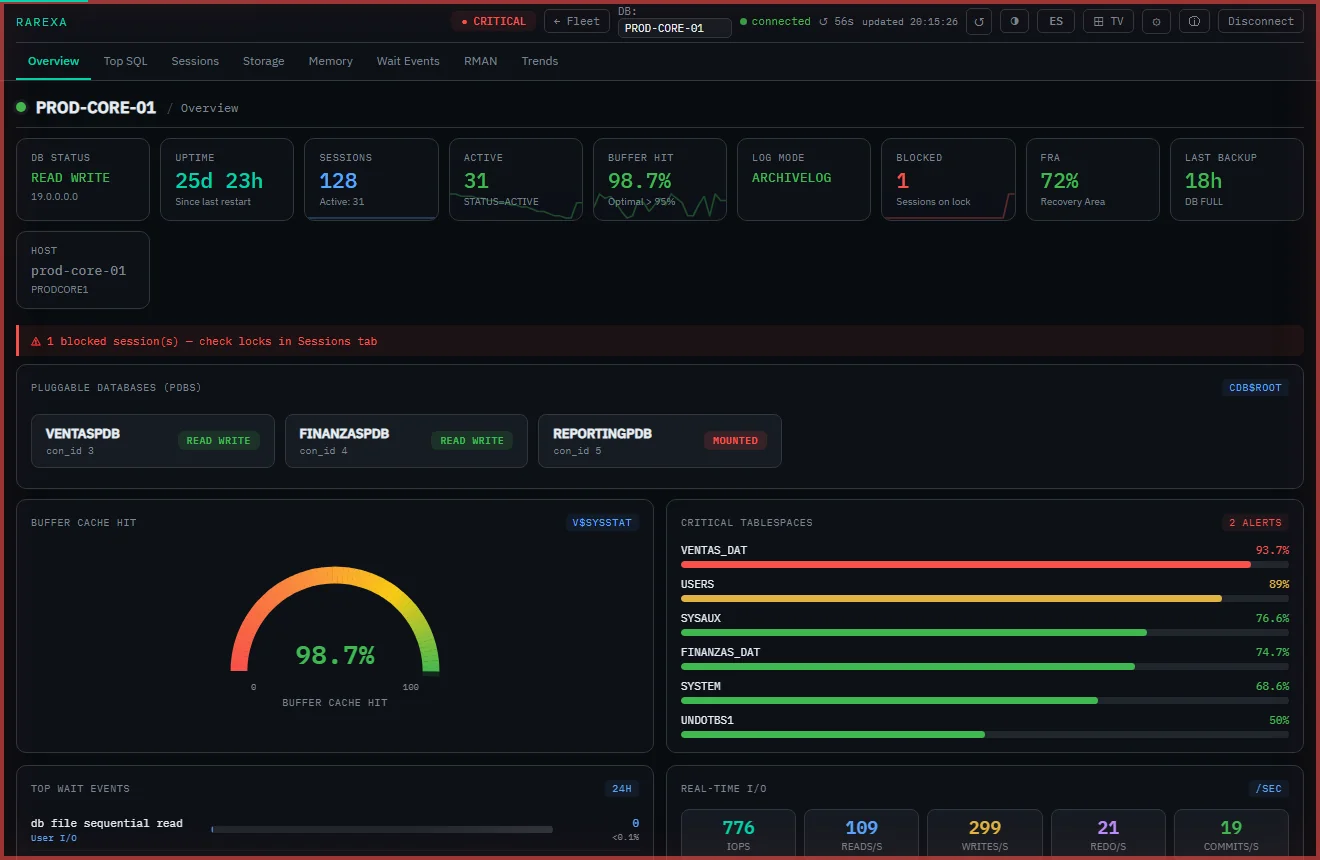
Yes, ours — and here's the case. Rarexa does one job: it answers "is every Oracle database healthy, and if not, where?" on a single screen. Fleet view with live health per database, sessions and blocking, storage measured against the autoextend ceiling with a days-to-full forecast, SGA/PGA, wait events, Top SQL and RMAN backup freshness — with email/Telegram alerts and an auto-rotating NOC TV mode. It's one native binary (Windows or Linux), agentless over SQL*Net, reads only always-licensed views (no Diagnostic Pack risk, ever), and is priced flat and publicly: $390/yr (3 DBs), $2,900/yr (25), from $4,900/yr unlimited. Fifteen minutes from download to live data; 15-day full trial.
Don't buy it for: AWR-grade tuning forensics, cross-vendor databases, or management tasks (patching, provisioning). It's deliberately not a platform. Full deep-dive →
2. Oracle Enterprise Manager — best when you manage, not just monitor
The incumbent, and for good reason: nothing else patches, provisions, enforces compliance and monitors across a huge Oracle estate. If you run hundreds of targets with a tools team, OEM earns its infrastructure. The catches are well known: it's a platform to operate (OMS, repository, agents everywhere), and the screens DBAs actually open daily — performance pages, AWR, ADDM — require the per-core Diagnostic Pack, which on a single 32-core server runs around $120,000 at list plus yearly support (the math).
Don't buy it for: "just tell me if it's healthy." That's using a freight train to deliver a letter — see the alternatives landscape.
3. SolarWinds Database Performance Analyzer — best for "why was it slow?"
DPA's wait-time analytics continuously sample what sessions wait on and keep the history, so you can reconstruct last Tuesday's slowdown by SQL, wait event and time window — across Oracle, SQL Server, MySQL, PostgreSQL and more. Agentless toward targets, with anomaly detection on top. It's a genuinely good tuning investigator.
Don't buy it for: fleet health basics. You'd be paying per-instance, quote-based prices and running a central server + repository to answer questions a lightweight dashboard answers for a flat fee. Rarexa vs DPA, head to head →
4. Quest Foglight — best for the enterprise "one console" mandate
Foglight is a monitoring platform: management server, repository, per-technology cartridges, covering databases of several vendors plus virtualization and infrastructure. Performance Investigator adds deep workload analytics and change tracking. When the CIO wants everything under one roof with one vendor, Foglight is a serious answer.
Don't buy it for: a twelve-database Oracle fleet with no tools team — the platform tax (deployment days, operation, per-instance quotes) dwarfs the job. Rarexa vs Foglight, head to head →
5. dbWatch Control Center — best for very large farms and MSPs
dbWatch targets estates of hundreds of instances across SQL Server, Oracle, PostgreSQL and MySQL, mixing monitoring with routine management jobs, per-instance licensing, all on-premise. Managed-service providers and big internal estates are its home turf.
Don't buy it for: a small-to-mid Oracle fleet — farm-scale machinery, farm-scale console.
6. Prometheus + Grafana (oracledb_exporter) — best free option if you own an observability stack
The DIY champion: an Oracle exporter feeds Prometheus, Grafana draws it, Alertmanager pages you. Completely free, infinitely flexible, and consistent with how you may already monitor everything else. Two honest warnings: you encode all the Oracle knowledge (what a tablespace means, when RMAN is "late"), dashboard by dashboard — it's a project, not a download; and check your exporter's queries, because some community configurations touch pack-gated views.
Don't pick it if: nobody on the team has time to build and maintain the Oracle layer. Free software, expensive hobby.
7. Zabbix — best free option for classic IT monitoring shops
Zabbix ships Oracle templates out of the box (via Zabbix agent 2 / ODBC), covers servers and network gear too, and is battle-tested in traditional IT departments. Same trade as Prometheus with different ergonomics: free and capable, but generic — the Oracle depth is what you configure, not what it knows.
Don't pick it if: you want Oracle-native concepts (days-to-full, RMAN freshness, pack-safety) working on day one.
8. Datadog Database Monitoring — best for cloud-native, SaaS-first teams
If your world is already Datadog — APM, logs, infra — its Database Monitoring extends the same console to query metrics and explain plans, with slick correlation between app and database. It's SaaS, priced per host per month, agent-based, and your telemetry lives in Datadog's cloud.
Don't pick it if: your databases are on-premise and your security posture says monitoring data doesn't leave the network — or if per-host SaaS pricing across a fleet makes your procurement wince. (Rarexa's answer to both: fully on-premise, zero telemetry, flat price.)
How to choose in three questions
- Watch or manage? If you need patching/provisioning, it's OEM (or Foglight for multi-vendor). If you need watching, keep reading.
- Health or forensics? Daily "is it OK?" → focused dashboard (Rarexa). Recurring "why was it slow?" → DPA, or OEM's packs if you already license them.
- Tool or project? If you have platform engineers eager to own monitoring, Prometheus/Zabbix are free and honorable. If you want it working this afternoon with nobody assigned to it, buy a tool with the Oracle knowledge built in.
And whatever you shortlist, ask every vendor the licensing question in writing: "which Oracle views does your tool query?" — the wrong answer turns a monitoring purchase into a Diagnostic Pack audit finding.
Frequently asked questions
What is the best tool to monitor an Oracle database?
Is there a free Oracle monitoring tool?
Do Oracle monitoring tools require the Diagnostic Pack?
Start with the 15-minute option
Rarexa's trial is the full product — if it doesn't answer your daily question better than what you have, delete it and pick another row from the table.
Download the free trialOracle, SolarWinds, Quest, Foglight, dbWatch, Zabbix, Datadog, Prometheus and Grafana are trademarks of their respective owners; Rarexa is not affiliated with any of them. Third-party characteristics summarized from public materials — verify current features and pricing with each vendor.