Oracle database monitoring: the complete guide (2026)
Monitoring Oracle well isn't about buying the biggest platform — it's about watching the right things, the right way, and acting before small problems become outages. This guide covers what to monitor, the SQL behind each metric, and how to do it without Enterprise Manager or the Diagnostic Pack. Each section links to a deeper how-to.
What to monitor: the seven essentials
Skip the noise. For day-to-day operations, these seven answer "is everything OK, and if not, where?":
- Health status — a single NORMAL / WARNING / CRITICAL roll-up per database.
- Sessions & blocking — active sessions, and anything blocked by locks.
- Storage — tablespace usage, autoextend headroom, FRA.
- Capacity — days-to-full, computed from real growth.
- Memory — SGA/PGA distribution and buffer cache hit ratio.
- Performance — wait events and Top SQL.
- Backups — RMAN job status and freshness.
1. Health, sessions & blocking
Everything starts with V$SESSION: who's connected, what they're doing, and who is blocked. A session waiting on enq: TX - row lock contention behind a long transaction is the classic 3 a.m. call. Roll active sessions, blocked counts and system stats into one health indicator so a glance tells you whether to dig deeper.
2. Storage & tablespaces
A full tablespace stops your application. The trick is measuring usage against the autoextend ceiling (MAXBYTES), not the currently allocated size — otherwise an autoextensible tablespace at "98%" looks like an emergency when it isn't, and vice-versa.
→ Full walkthrough with the exact SQL: How to monitor Oracle tablespaces without Enterprise Manager.
3. Capacity: days-to-full
A percentage is a snapshot; capacity planning needs a trend. Keep daily snapshots of used space and fit a line with REGR_SLOPE to turn growth into a concrete days-to-full number — the metric that actually tells you when to act.
→ Step-by-step: How to predict when an Oracle tablespace will fill up.
4. Memory, waits & Top SQL
V$SGASTAT and V$PGASTAT show where memory goes; the buffer cache hit ratio hints at whether reads are served from memory or disk (with caveats). V$SYSTEM_EVENT ranks your wait events so you attack the real bottleneck, and V$SQL surfaces the most expensive statements by CPU and elapsed time. Together they answer "why is it slow?" without AWR.
5. RMAN backups
A backup you don't verify is a backup you don't have. V$RMAN_BACKUP_JOB_DETAILS gives you the last jobs, their status, duration and size — enough to alert the moment a backup fails or falls behind its schedule.
How to monitor: scripts vs. platform vs. dashboard
There are three honest paths, covered in depth in Oracle Enterprise Manager alternatives in 2026:
- Scripts — free and flexible, but you maintain a UI, history and alerting forever.
- General observability (Prometheus/Zabbix/Grafana) — great for one pane across infra, but you teach it Oracle.
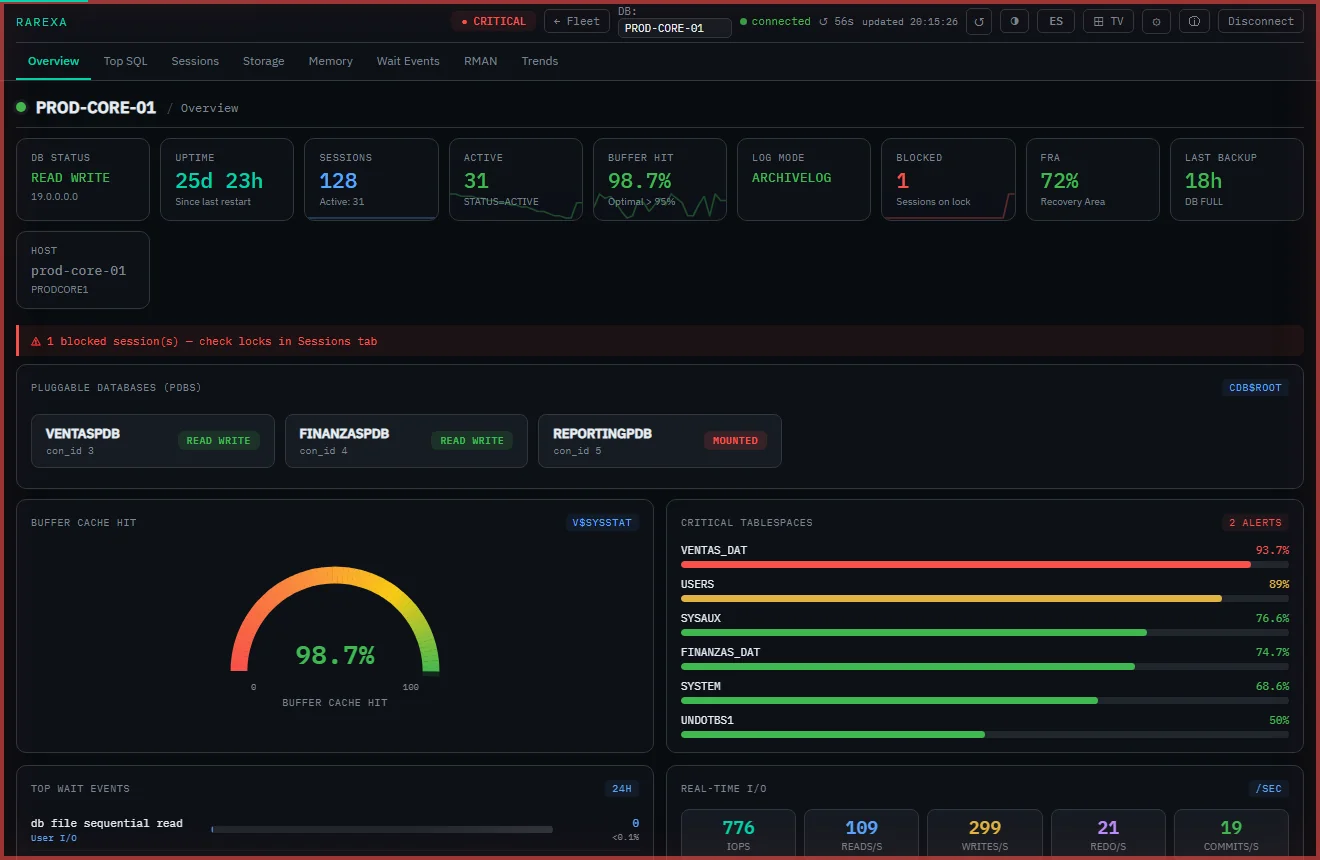
- A focused read-only dashboard — knows Oracle, installs in minutes, no agents, no packs. (That's what Rarexa is.)
The right way to connect: read-only
Whatever tool you choose, connect with a dedicated, least-privilege account — never SYSTEM or a DBA. CREATE SESSION plus SELECT_CATALOG_ROLE is the standard, with explicit grants if your policy is stricter.
→ Exact statements (non-CDB and CDB/PDB): How to create a read-only Oracle monitoring user.
A note on cost & the Diagnostic Pack
Most of what's above uses always-licensed views — no extra cost. The moment you open AWR, ADDM or ASH, you're using the per-core Diagnostic Pack. If your goal is health and capacity, you can stay pack-free entirely.
→ The math: How much does the Oracle Diagnostic Pack really cost? · And a side-by-side: Rarexa vs Oracle Enterprise Manager.
Frequently asked questions
What should you monitor in an Oracle database?
Can you monitor Oracle without Enterprise Manager or the Diagnostic Pack?
What is the easiest way to monitor Oracle?
Everything in this guide, automated
Rarexa Oracle Health Dashboard monitors all seven essentials across your fleet — read-only, no Diagnostic Pack. Free 15-day trial.
Download the trial