Oracle Database Monitoring Software
Real-time monitoring for your whole Oracle fleet — sessions, storage, Top SQL, RMAN backups and alerts on one clean screen — without Oracle Enterprise Manager or the Diagnostic Pack. No agents, on-premise.
No credit card · Windows and Linux · Offline Machine ID activation
Everything you need. Nothing you don't.
Built by a DBA for DBAs — every feature exists because someone needed it in the real world.
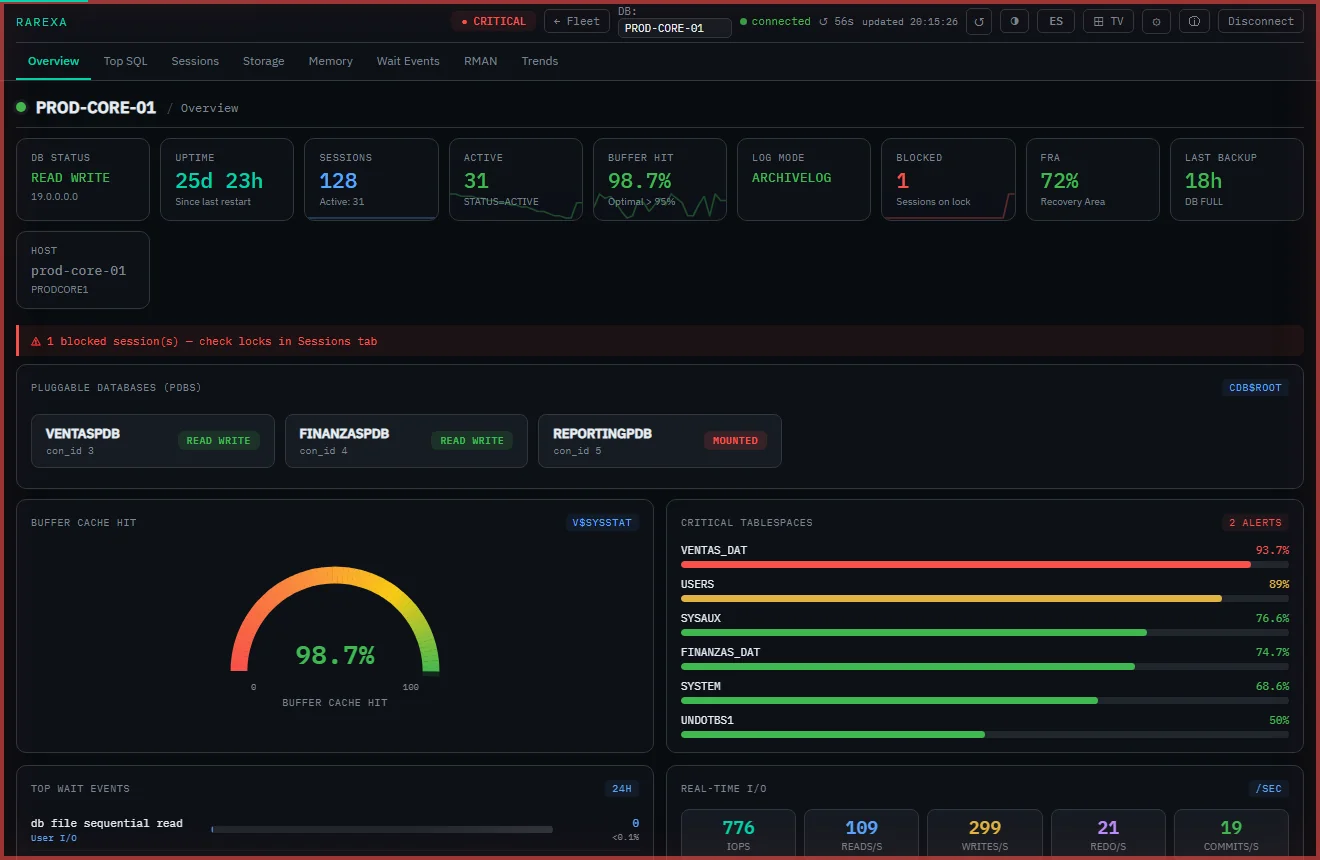
Real-Time Overview
Instant health status (NORMAL / WARNING / CRITICAL), active sessions, buffer cache hit ratio and system statistics — updated automatically every 60 seconds.
Storage Intelligence
Visual progress bars for every tablespace with autoextend detection, free-space trending, days-to-full and alerts when thresholds are exceeded.
Top SQL Profiling
Identify the most resource-intensive queries by CPU time and elapsed time. Find what's hurting your performance in seconds.
RMAN Backup History
Recent backup jobs at a glance — type, status, duration, input/output GB. Spot failed backups before they become a disaster.
Email & Telegram Alerts
Configurable SMTP and Telegram Bot notifications. Get alerted the moment a database transitions to WARNING or CRITICAL — no polling needed.
TV / Operations Mode
Auto-rotate through tabs and databases on a configurable interval. Perfect for NOC screens, operations rooms or any always-on monitoring display.
SGA / PGA Memory
Detailed breakdown of SGA components and PGA statistics. Understand memory pressure and identify misconfigured pools instantly.
Fleet View & Profiles
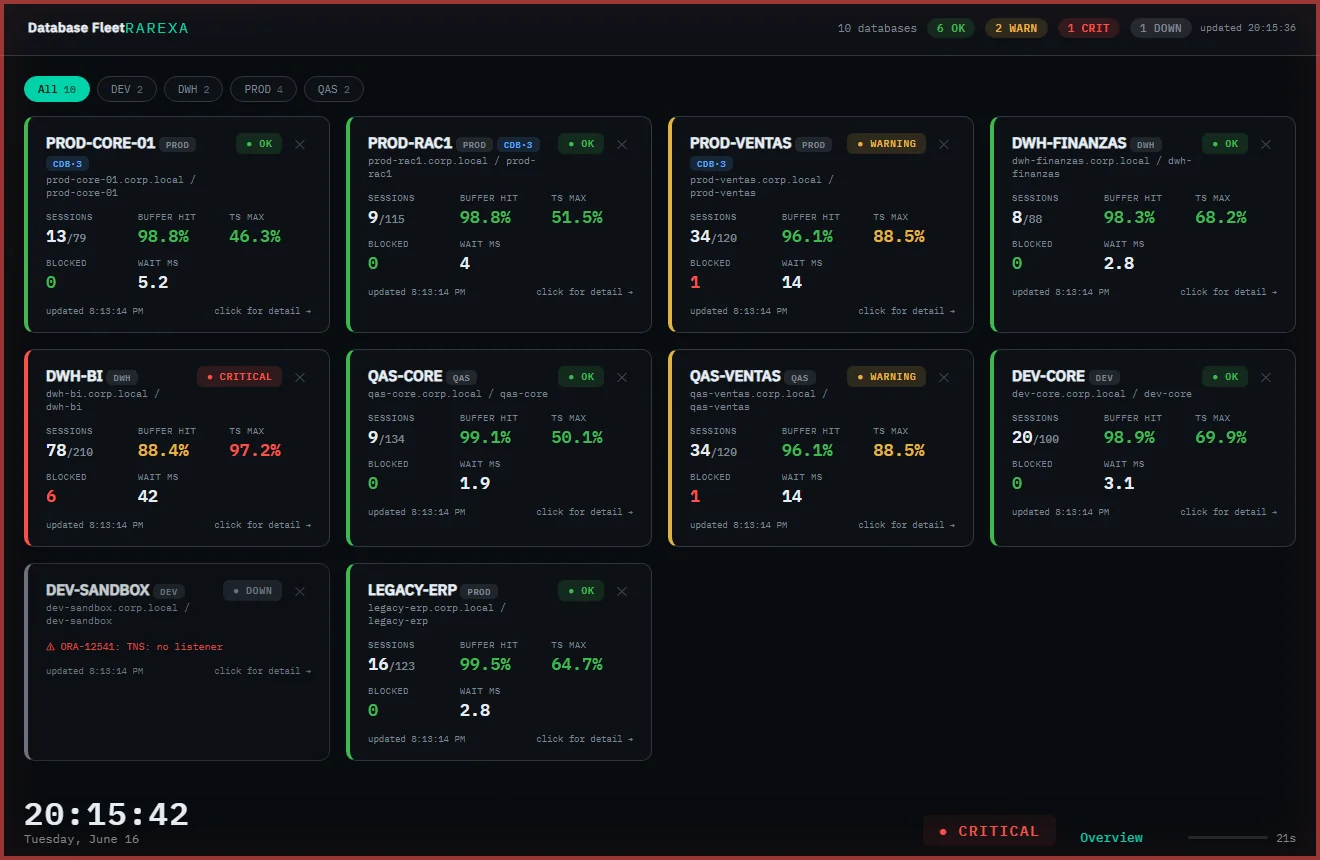
Save and switch between multiple connection profiles with one click. The fleet view shows prod, staging and dev at once, each with its health.
ES / EN Interface
Full Spanish and English interface — switch languages with one click. Built for Latin American DBAs and international teams alike.
From a single database to your whole fleet
Switch between the fleet view — one card per database with its health — and the deep detail of any instance with a click. TV mode rotates on its own, no keyboard required.
- Fleet grid — one card per database, colour-coded health (OK / warning / critical / down).
- One click drops you into any instance's deep detail.
- TV mode auto-rotates the NOC wall — hands-off.
Five ways to install it. You choose.
The same product, packaged for every environment. Everything runs on your own infrastructure.
Runs as a Windows service or Linux daemon and starts with the system.
Simple annual pricing.
Annual subscription. Updates and support included. Less than a single month of the Oracle Diagnostic Pack.
For an individual DBA or consultant. One machine, up to 3 databases.
- Up to 3 monitored databases
- Windows, Linux & Docker
- All monitoring tabs
- Email & Telegram alerts
For a small team. One server, up to 10 databases, all deployment methods.
- Up to 10 monitored databases
- Windows Service · MSI · Docker · systemd
- Fleet view & TV mode (NOC)
- CDB/PDB, IOPS, trends & capacity
For a team. One server, up to 25 databases, all deployment methods.
- Up to 25 monitored databases
- Windows Service · MSI · Docker · systemd
- Fleet view & TV mode (NOC)
- CDB/PDB, IOPS, trends & capacity
Multiple servers, priority support and SLA. Tailored to your fleet.
- Unlimited monitored databases
- Everything in Server, multiple servers / sites
- Priority support & SLA
- Multi-year discounts & volume licensing
Machine ID-based offline licensing · 15-day free trial · multi-year discounts available
Common questions.
Does it work with Oracle XE (Express Edition)?
Does the dashboard modify anything in my database?
Does it work with Oracle on cloud? (OCI, AWS RDS, Azure)
Is there a free trial?
Start monitoring your Oracle fleet in the next 5 minutes.
Download, run, connect. No agents. No complexity. No Enterprise Manager license required.