Oracle database health check: the complete 2026 checklist
A good health check isn't a 200-line script you run once and never read. It's a short, repeatable routine that answers one question — is every database OK, and if not, where? — using views Oracle already licenses. This is the exact checklist I run, the SQL behind each item, and how often to run it. No Enterprise Manager, no Diagnostic Pack.
The right way to connect: a read-only account
Never run a health check as SYS. Create a dedicated account with read access to the dictionary and nothing more — that way the check can never change anything, and it satisfies the security review:
CREATE USER ohd_monitor IDENTIFIED BY "a-strong-password";
GRANT CREATE SESSION TO ohd_monitor;
GRANT SELECT_CATALOG_ROLE TO ohd_monitor;   -- read-only on V$ and DBA_ views
That is the entire footprint. If your policy needs it even tighter, we list the exact per-view GRANTs in how to create a read-only Oracle monitoring user.
Daily checks — the non-negotiables
These four catch almost every 3 a.m. incident. Run them every morning (or let something run them for you).
1. Is the instance up, open and archiving?
Availability first — everything else is moot if the instance isn't open:
SELECT instance_name, status, database_status, archiver, logins
FROM   v$instance;
SELECT name, open_mode, database_role, log_mode
FROM   v$database;
You want status = OPEN, archiver = STARTED (on archivelog databases) and, on a primary, open_mode = READ WRITE. A stuck archiver is a classic silent killer — it freezes the database when the FRA fills.
2. Blocking sessions — who is stuck behind whom?
One long transaction holding a row lock can stall an application without a single error in the alert log. Find blockers and their victims:
SELECT s.blocking_session, s.sid, s.serial#, s.username,
       s.event, s.seconds_in_wait, q.sql_text
FROM   v$session s
LEFT JOIN v$sql q ON q.sql_id = s.sql_id
WHERE  s.blocking_session IS NOT NULL
ORDER BY s.seconds_in_wait DESC;
Empty result = nobody blocked. Rows that keep growing seconds_in_wait = go look now.
3. Storage headroom — tablespaces & FRA
A full tablespace stops writes. Measure usage against the autoextend ceiling (MAXBYTES), not the current size, so an autoextensible tablespace at "98%" doesn't cry wolf:
SELECT df.tablespace_name,
       ROUND(used_mb,0) AS used_mb,
       ROUND(max_mb,0)  AS max_mb,
       ROUND(used_mb/max_mb*100,1) AS pct_of_max
FROM (
  SELECT tablespace_name,
         SUM(bytes)/1024/1024 AS alloc_mb,
         SUM(GREATEST(bytes,
             DECODE(autoextensible,'YES',maxbytes,bytes)))/1024/1024 AS max_mb
  FROM dba_data_files GROUP BY tablespace_name) df
JOIN (
  SELECT tablespace_name,
         df2.alloc_mb - NVL(fs.free_mb,0) AS used_mb
  FROM (SELECT tablespace_name, SUM(bytes)/1024/1024 alloc_mb
        FROM dba_data_files GROUP BY tablespace_name) df2
  LEFT JOIN (SELECT tablespace_name, SUM(bytes)/1024/1024 free_mb
              FROM dba_free_space GROUP BY tablespace_name) fs
         ON df2.tablespace_name = fs.tablespace_name) u
  ON df.tablespace_name = u.tablespace_name
ORDER BY pct_of_max DESC;
Also glance at the Fast Recovery Area — a full FRA halts archiving and, with it, the database:
SELECT name, ROUND(space_used/space_limit*100,1) AS pct_used
FROM   v$recovery_file_dest;
4. Did last night's backup actually run?
The worst time to discover a broken backup is when you need it. Check RMAN's own view for the last completed backup and its status:
SELECT input_type, status,
       TO_CHAR(end_time,'YYYY-MM-DD HH24:MI') AS finished,
       ROUND((SYSDATE-end_time)*24,1) AS hours_ago
FROM   v$rman_backup_job_details
ORDER BY end_time DESC FETCH FIRST 5 ROWS ONLY;
You want a recent COMPLETED (not FAILED or COMPLETED WITH WARNINGS) inside your RPO window. "18 hours ago, COMPLETED" is a good morning; "3 days ago" is a bad one.
Weekly checks — trends & capacity
5. Days-to-full: capacity, not a snapshot
"USERS is 90% full" tells you nothing without a rate. Keep a small daily history table and fit a line to it to get days-to-full — the number that actually lets you plan. The full method (with REGR_SLOPE) is in how to predict when a tablespace will fill up.
6. Memory: SGA/PGA and the hit ratios
Not for chasing a magic number, but for spotting drift — a buffer cache hit ratio that quietly falls week over week is a signal:
SELECT component, ROUND(current_size/1024/1024) AS mb
FROM   v$sga_dynamic_components WHERE current_size > 0;

SELECT ROUND((1 - (phy.value / (db.value + con.value))) * 100, 2) AS buffer_hit_pct
FROM   v$sysstat phy, v$sysstat db, v$sysstat con
WHERE  phy.name = 'physical reads'
  AND  db.name  = 'db block gets'
  AND  con.name = 'consistent gets';
7. Top SQL: what is working the database hardest?
You don't need the Tuning Pack to find your heaviest statements — V$SQL is always licensed. Rank by elapsed time per execution and buffer gets:
SELECT * FROM (
  SELECT sql_id,
         ROUND(elapsed_time/1e6,1) AS elapsed_s,
         executions,
         ROUND(elapsed_time/1e6/GREATEST(executions,1),3) AS s_per_exec,
         buffer_gets,
         SUBSTR(sql_text,1,80) AS sql_text
  FROM   v$sql
  ORDER BY elapsed_time DESC)
WHERE ROWNUM <= 15;
We go deeper on this in find your worst SQL in Oracle without the Tuning Pack.
Monthly checks — drift & hygiene
- Invalid objects — recompile creep after changes:
SELECT owner, object_type, COUNT(*) FROM dba_objects WHERE status = 'INVALID' GROUP BY owner, object_type; - Non-default parameters — drift review:
SELECT name, value FROM v$parameter WHERE isdefault = 'FALSE' ORDER BY name; - Failed logins / locked accounts — security hygiene from
DBA_USERSand the audit trail. - Stats freshness — stale optimizer stats on big tables: check
DBA_TAB_STATISTICS.last_analyzed.
Automate it: script, cron, or dashboard
Three honest options, from most-work to least:
- SQL script + scheduler. Wrap the queries above in a SQL*Plus/SQLcl script and schedule it (cron, DBMS_SCHEDULER). Free, but you build the alerting, the HTML report and the multi-database loop yourself — and someone has to actually read the output every morning.
- Enterprise Manager. Powerful, but it's a platform to operate and the performance screens want the Diagnostic Pack — see Rarexa vs Oracle Enterprise Manager.
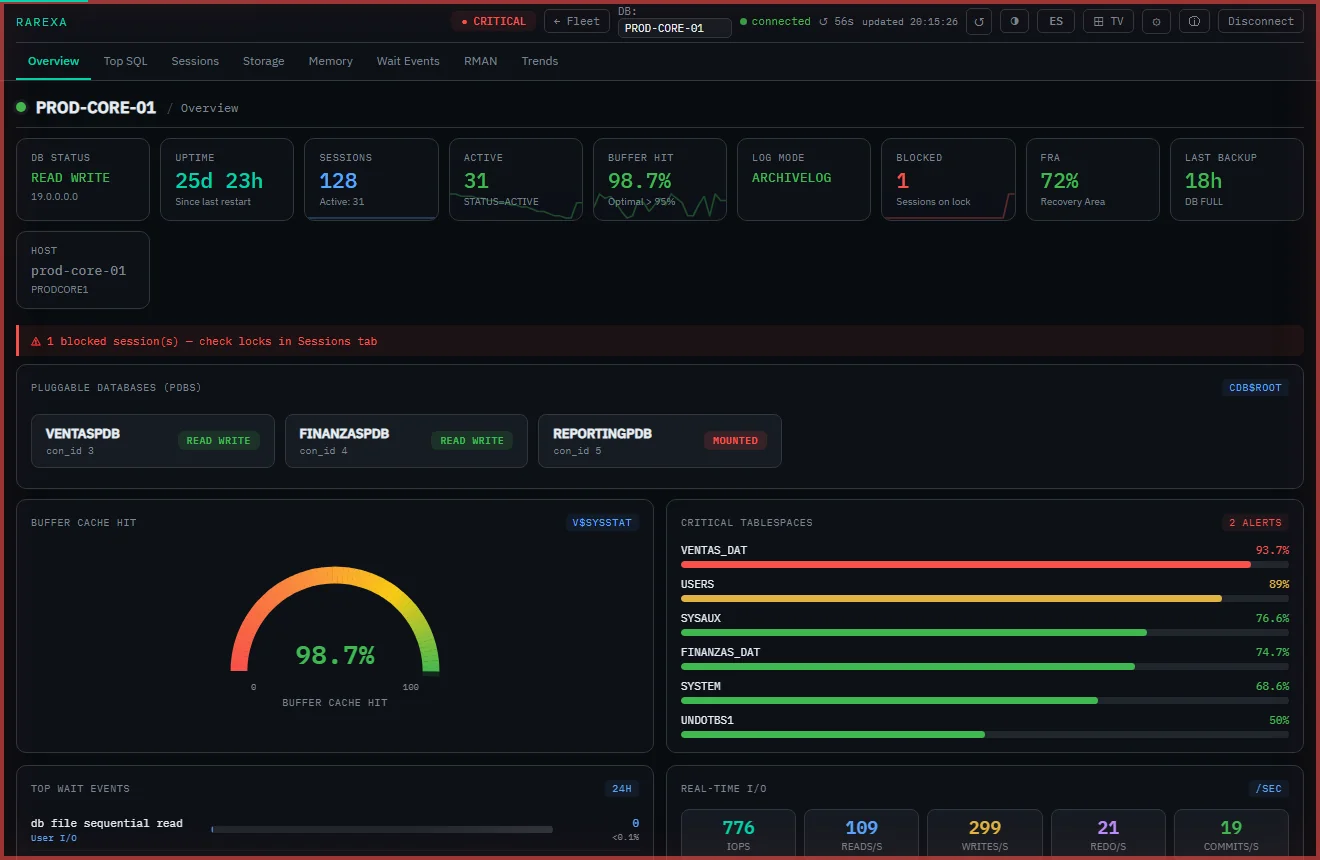
- A focused dashboard. A read-only tool that runs exactly this checklist across your whole fleet, colour-codes each database, and alerts you before a threshold trips — no agents, no packs, live in 15 minutes.
The one-screen checklist
Weekly: days-to-full per tablespace · SGA/PGA & hit ratio trend · Top SQL review.
Monthly: invalid objects · parameter drift · security & login review · stats freshness.
Run it as a routine, not a fire drill, and the 3 a.m. calls quietly disappear.
Frequently asked questions
What is an Oracle database health check?
How do I run an Oracle health check without the Diagnostic Pack?
How often should I run an Oracle database health check?
Run this whole checklist automatically
Rarexa Oracle Health Dashboard runs every check on this page across your fleet — read-only, no Diagnostic Pack. Free 15-day trial.
Download the free trial