Find your worst SQL in Oracle without the Tuning Pack
You don't need a licensed advisor to find the queries hurting your database. Oracle already tracks per-statement cost in V$SQL — an always-licensed view. This is how to rank your heaviest SQL by the metric that matters, pull the real execution plan, and do it all without triggering the Tuning Pack or Diagnostic Pack.
V$SQL, V$SQLSTATS and V$SQL_PLAN requires neither. Every query below is pack-free.
Rank by the metric that matters (not just "slow")
"Worst" depends on what you're chasing. The same view answers all of them — you just change the ORDER BY.
By total time consumed (the usual starting point)
SELECT * FROM (
  SELECT sql_id, child_number,
         ROUND(elapsed_time/1e6,1)                      AS total_s,
         executions,
         ROUND(elapsed_time/1e6/GREATEST(executions,1),3) AS s_per_exec,
         SUBSTR(sql_text,1,90)                          AS sql_text
  FROM   v$sql
  ORDER BY elapsed_time DESC)
WHERE ROWNUM <= 15;
Total elapsed finds the statements eating the most wall-clock across all their runs — the ones tuning actually pays off on.
By work per execution (the "expensive singleton")
SELECT * FROM (
  SELECT sql_id,
         buffer_gets, disk_reads, executions,
         ROUND(buffer_gets/GREATEST(executions,1))  AS gets_per_exec,
         SUBSTR(sql_text,1,90)                     AS sql_text
  FROM   v$sql
  WHERE  executions > 0
  ORDER BY buffer_gets/GREATEST(executions,1) DESC)
WHERE ROWNUM <= 15;
High gets per execution is the fingerprint of a bad plan — a full scan where an index belongs, or a join order gone wrong.
By sheer frequency (the "cheap but relentless")
A query that costs 5ms but runs 2 million times a day can outweigh a 10-second monster. Order by executions to find it — often the fix is a caching layer or fewer round-trips, not the SQL itself.
Get the real execution plan (pack-free)
Once you have a sql_id, don't guess the plan — read the one Oracle actually used, straight from V$SQL_PLAN:
SELECT * FROM TABLE(
  DBMS_XPLAN.DISPLAY_CURSOR('&sql_id', NULL, 'ALLSTATS LAST'));
DISPLAY_CURSOR reads the always-licensed plan view — this is the true, executed plan (with actual vs estimated rows if the statement ran with row-source statistics), not an EXPLAIN PLAN guess. It's the single most useful pack-free tuning tool most DBAs forget they already have.
V$SQLSTATS: lighter and a bit more stable
For a fleet health check, V$SQLSTATS aggregates the same metrics per sql_id with less overhead and better retention than V$SQL as cursors age out of the shared pool:
SELECT sql_id, executions,
       ROUND(elapsed_time/1e6,1)  AS total_s,
       ROUND(cpu_time/1e6,1)      AS cpu_s,
       buffer_gets, disk_reads
FROM   v$sqlstats
ORDER BY elapsed_time DESC FETCH FIRST 15 ROWS ONLY;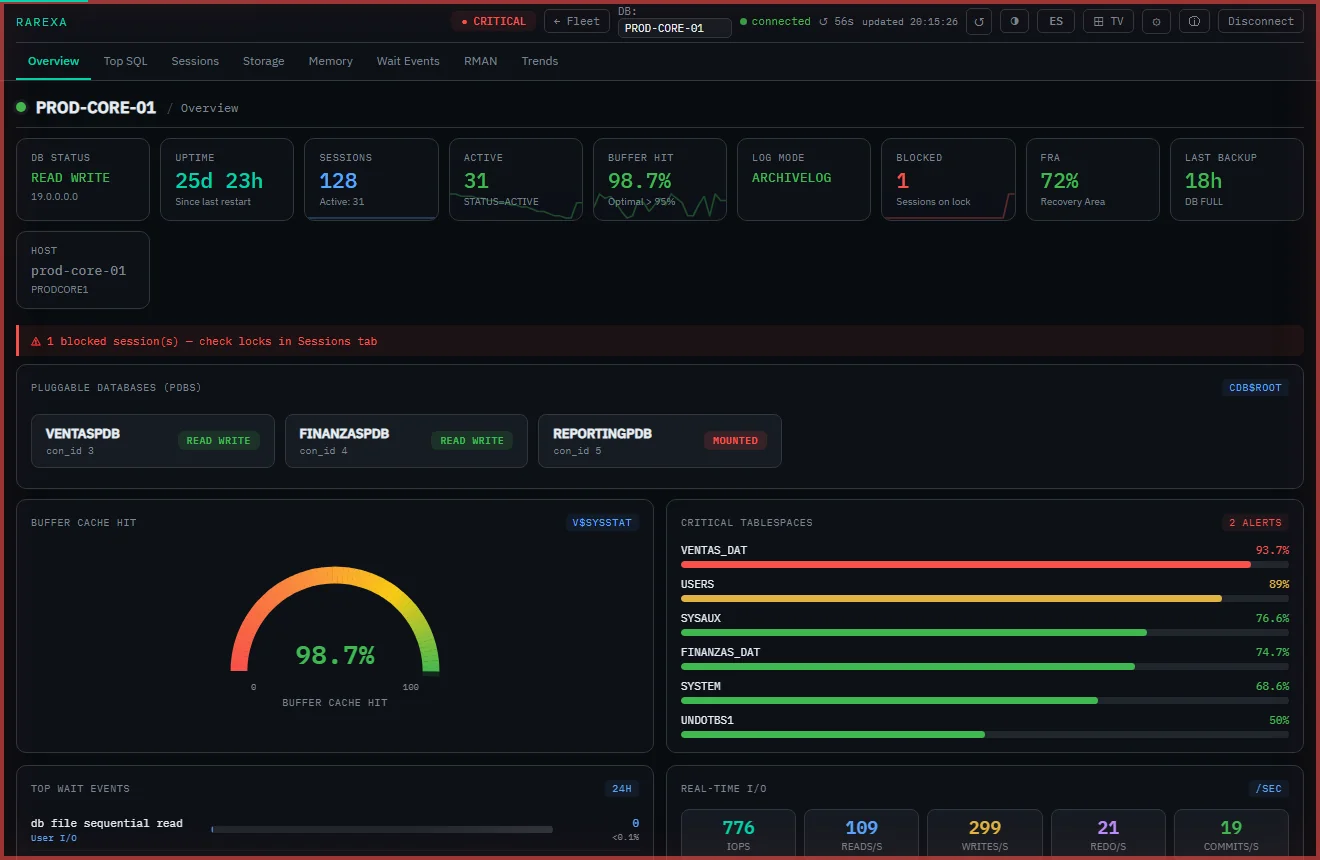
The one caveat (be honest about it)
V$SQL only holds cursors currently in the shared pool. Once a statement ages out, it's gone from that view — so this is a great tool for "what's heavy right now / today," not for "what ran at 2 a.m. three weeks ago." That historical question is exactly what AWR/ASH answer, and that's where the Diagnostic Pack line is. For most day-to-day tuning, "right now" is what you need — capture it on a schedule (or with a dashboard) and you keep your own lightweight history without the pack. We put the licensing math in context in how much the Diagnostic Pack really costs.
Fold it into the routine
A Top-SQL glance belongs in your weekly health check: pull the top 15 by elapsed time, compare against last week, and the newcomers — the queries that just started hurting — are your tuning list. Pair it with the wait-event view and you know both which SQL is heavy and why.
Frequently asked questions
How do I find the top SQL in Oracle without the Tuning Pack?
What is the difference between the Diagnostic Pack and the Tuning Pack?
Can I see an execution plan without the Tuning Pack?
Keep an eye on your heaviest SQL — pack-free
Rarexa surfaces Top SQL across your fleet from always-licensed views, with its own lightweight history. Free 15-day trial.
Download the free trial