Oracle wait events explained: the 12 that actually matter
There are over a thousand Oracle wait events. You need to recognise about a dozen. A wait event is simply what a session is waiting for when it isn't on the CPU — and grouping time by wait event is the fastest honest answer to "why is it slow?". Here are the twelve worth knowing, in plain language, with what causes each and what to do.
First, the wait classes
Every event belongs to a class — that's your triage level. Before naming events, see where time is going by class:
SELECT wait_class,
       ROUND(time_waited/100,1) AS seconds_waited,
       total_waits
FROM   v$system_wait_class
WHERE  wait_class != 'Idle'
ORDER BY time_waited DESC;
If User I/O dominates, you're disk-bound. Concurrency means locking/latching. Commit points at redo. That one query aims your investigation before you read a single event name.
The 12 events worth recognising
User I/O
1. db file sequential read — single-block reads, almost always index access. Normal; a problem only when it dominates → physical I/O pressure or an index that's inefficient (or missing).
2. db file scattered read — multi-block reads, i.e. full table/index scans. A little is fine; a lot on big tables often means a missing index or a plan that flipped to a full scan.
3. direct path read / write — reads/writes that bypass the buffer cache (big scans, parallel query, temp spills). Watch for large sorts/hashes spilling to temp.
4. read by other session — you waited for a block another session was already reading. A hot-block symptom, common on popular index roots.
Concurrency & locking
5. enq: TX - row lock contention — the classic blocking wait: a session wants a row another session has locked in an open transaction. This is the one behind most "the app froze" tickets — see monitoring blocking sessions.
6. enq: TM - contention — a table-level lock, often an unindexed foreign key biting during DML on the parent. Index your FKs.
7. buffer busy waits — two sessions want the same block in an incompatible way. Points at a hot block or, on inserts, right-hand-index contention.
8. latch: cache buffers chains — CPU-level contention for buffer-cache access, usually driven by a few very hot blocks or an inefficient plan hammering the same buffers.
Commit, redo & config
9. log file sync — the session committed and is waiting for LGWR to flush redo to disk. High values = slow redo storage, or an application committing far too often (row-by-row commits).
10. log file parallel write — LGWR's own write to the redo logs. If this rises with log file sync, it's genuinely the redo storage, not the app.
11. library cache: mutex X — parsing contention, the hallmark of non-shareable SQL (literals instead of bind variables). The fix is bind variables, not more memory.
12. gc buffer busy / gc cr request (RAC only) — global cache waits: a block is being shipped between instances over the interconnect. Points at cross-instance hot blocks or interconnect pressure.
Seeing waits live (no Diagnostic Pack)
What is every session waiting on right now:
SELECT event, wait_class, COUNT(*) AS sessions
FROM   v$session
WHERE  state = 'WAITING' AND wait_class != 'Idle'
GROUP BY event, wait_class
ORDER BY sessions DESC;
And the cumulative top events since startup, average wait included:
SELECT event,
       total_waits,
       ROUND(time_waited/100,1)              AS seconds_waited,
       ROUND(average_wait*10,1)              AS avg_ms
FROM   v$system_event
WHERE  wait_class != 'Idle'
ORDER BY time_waited DESC FETCH FIRST 15 ROWS ONLY;
All of the above lives in always-licensed views — V$SESSION, V$SYSTEM_EVENT, V$SYSTEM_WAIT_CLASS. Only historical wait analysis (AWR/ASH, "what happened at 2 a.m. last Tuesday") needs the Diagnostic Pack.
How to actually use this
Don't chase individual events. Triage by class first, confirm the dominant event, then ask the obvious question that event implies (missing index? too-frequent commits? an unindexed FK? literals instead of binds?). Nine times out of ten the answer is application- or schema-shaped, not "add more memory." Fold the live-waits query into your daily health check so a shift in the wait profile shows up before users feel it.
Frequently asked questions
What are Oracle wait events?
What is the most common Oracle wait event?
Can I see Oracle wait events without the Diagnostic Pack?
Watch your wait profile shift in real time
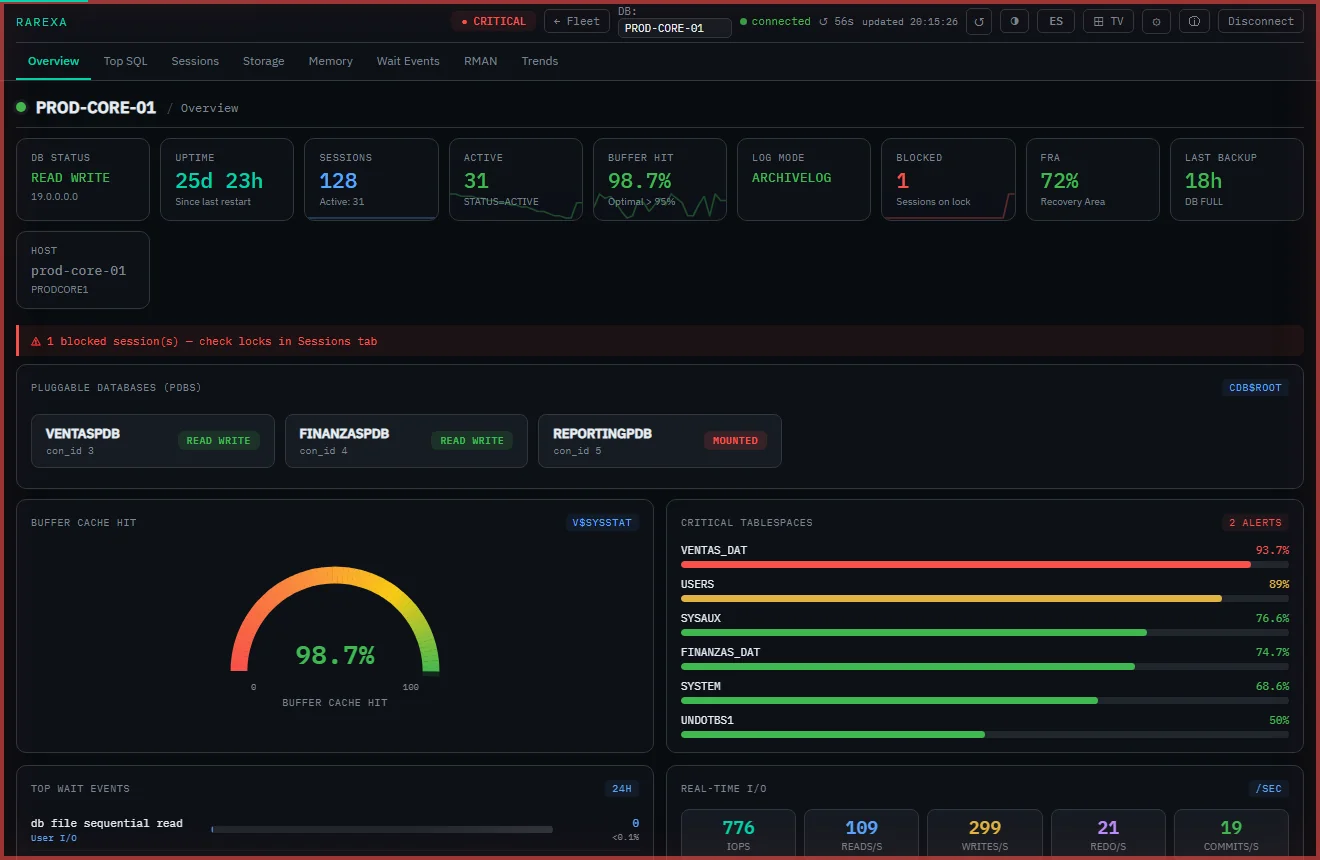
Rarexa shows live waits by class and event across your fleet — read-only, no AWR, no Diagnostic Pack. Free 15-day trial.
Download the free trial