How to monitor Oracle sessions and blocking locks
Most "the database is slow" tickets are really "one session is stuck behind another." The fix isn't a bigger tool — it's knowing the four queries that turn V$SESSION into a clear picture of who's connected, who's working, and who is blocked. Here they are, read-only, no Diagnostic Pack.
Start with V$SESSION: who's connected and what they're doing
Everything begins here. This gives you the live population — user, program, state and current wait — without the noise:
SELECT sid, serial#, username, status, machine, program,
       event, ROUND(last_call_et/60,1) AS mins_in_state
FROM   v$session
WHERE  type = 'USER'
ORDER BY status, last_call_et DESC;
status = ACTIVE is running a call right now; INACTIVE is connected but idle. A pile of ACTIVE sessions all on the same event is a contention smell worth following.
Active vs inactive — and the counts that matter
For a health check you usually want a roll-up, not 400 rows. Active count, total count, and how many are blocked:
SELECT COUNT(*) AS total,
       SUM(CASE WHEN status='ACTIVE' THEN 1 ELSE 0 END) AS active,
       SUM(CASE WHEN blocking_session IS NOT NULL THEN 1 ELSE 0 END) AS blocked
FROM   v$session WHERE type = 'USER';
Trend those three over a day and the shape of your workload — and its problems — jumps out.
The important one: who is blocking whom?
A blocked session is one waiting on a lock another session holds. BLOCKING_SESSION (populated since 10g) makes this a one-query answer — no more digging through V$LOCK by hand:
SELECT w.sid          AS waiter_sid,
       w.username     AS waiter_user,
       w.event        AS waiting_on,
       w.seconds_in_wait,
       b.sid          AS blocker_sid,
       b.username     AS blocker_user,
       b.status       AS blocker_status,
       SUBSTR(bq.sql_text,1,60) AS blocker_sql
FROM       v$session w
JOIN       v$session b  ON b.sid = w.blocking_session
LEFT JOIN  v$sql     bq ON bq.sql_id = b.prev_sql_id
WHERE      w.blocking_session IS NOT NULL
ORDER BY   w.seconds_in_wait DESC;
Read it as a sentence: "waiter 812 has been stuck 240s on enq: TX - row lock contention, blocked by session 415 (still INACTIVE — an idle transaction holding a lock)." That last part — a blocker that's INACTIVE — is the classic culprit: someone opened a transaction and walked away.
The full lock chain (when it's more than one hop)
Sometimes A blocks B blocks C. To see the whole tree at once, Oracle ships a hierarchical helper:
SELECT LEVEL, sid, username, blocking_session, event, seconds_in_wait
FROM   v$session
WHERE  LEVEL > 1 OR blocking_session IS NOT NULL
CONNECT BY PRIOR sid = blocking_session
START WITH blocking_session IS NULL
ORDER SIBLINGS BY seconds_in_wait DESC;
The session at the top of the chain (its own blocking_session is null) is the root cause — clear that one and the whole chain frees.
Ending a stuck session — carefully
Monitoring is read-only; acting is not. If you must clear a blocker, identify it precisely first (the queries above), confirm with the app owner, then — from an account that has the privilege, not your monitoring user:
-- Only after you are sure. This rolls back the session's transaction.
ALTER SYSTEM KILL SESSION '415,20933' IMMEDIATE;
The two numbers are sid,serial#. Killing a session rolls back its open transaction — never do it on a hunch.
Deadlocks: they resolve themselves, but leave a trail
Oracle detects deadlocks and kills one victim automatically (ORA-00060), so they rarely hang — but a rising count means an application locking pattern worth fixing. They're recorded in the alert log and a trace file; if deadlocks recur, that trace file names the exact rows and SQL involved.
Doing this across a whole fleet
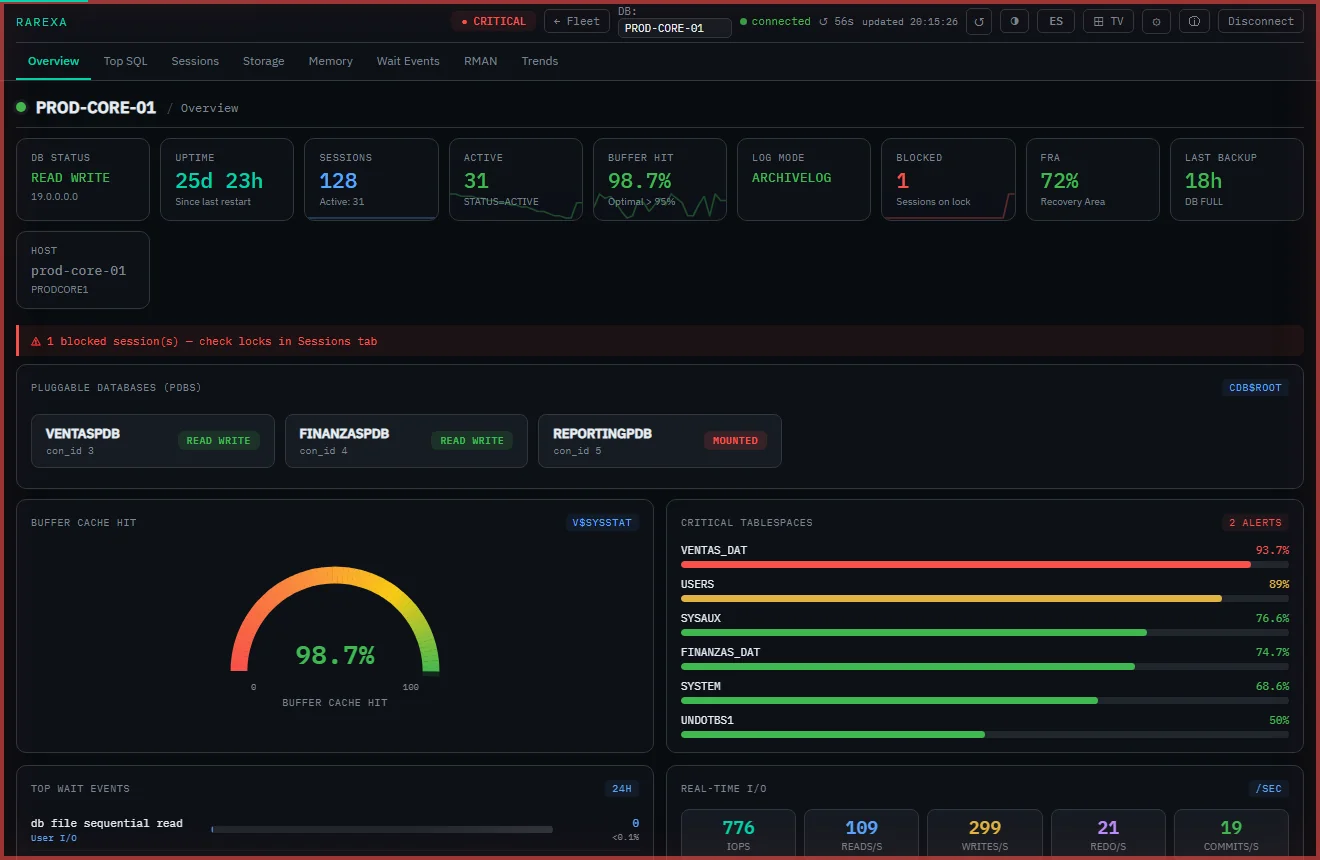
One database is a query. Twenty databases at 8 a.m. is a chore — you don't want to log into each one to run CONNECT BY. This is exactly the daily item a health-check routine should automate: a read-only dashboard that runs the blocking query against every database, colour-codes the ones with active blockers, and alerts you before a user does.
Frequently asked questions
How do I find blocking sessions in Oracle?
What is the difference between an active and inactive Oracle session?
Can I monitor Oracle sessions without the Diagnostic Pack?
See blockers before your users do
Rarexa watches sessions and the lock chain across your fleet, read-only, and alerts on active blocking. Free 15-day trial.
Download the free trial