How to predict when an Oracle tablespace will fill up
"USERS is 90% full" tells you almost nothing. Is that 90% growing a megabyte a week, or a gigabyte a day? A static percentage can't say. What you actually want is days-to-full — and to get it, you need two things: a little history, and a straight line through it.
Why a percentage isn't enough
Two tablespaces can both sit at 90%. One creeps up slowly and will be fine for months; the other is filling fast and dies tonight. Capacity planning is about rate of change, not a single reading. Oracle won't keep this growth history for you unless you're licensed for AWR — so the Diagnostic-Pack-free way is to keep a tiny history table yourself.
Step 1 — keep a small history table
One row per tablespace per snapshot is all you need:
CREATE TABLE ts_history (
  snap_time        DATE,
  tablespace_name  VARCHAR2(30),
  used_mb          NUMBER,
  max_mb           NUMBER
);
Step 2 — snapshot once a day
Schedule this insert (DBMS_SCHEDULER or cron). It reuses the autoextend-aware usage logic from the tablespace monitoring guide:
INSERT INTO ts_history (snap_time, tablespace_name, used_mb, max_mb)
SELECT SYSDATE, df.tablespace_name,
       df.alloc_mb - NVL(fs.free_mb,0), df.max_mb
FROM   (SELECT tablespace_name,
               SUM(bytes)/1024/1024 AS alloc_mb,
               SUM(GREATEST(bytes,
                   DECODE(autoextensible,'YES',maxbytes,bytes)))/1024/1024 AS max_mb
        FROM dba_data_files GROUP BY tablespace_name) df
LEFT JOIN (SELECT tablespace_name, SUM(bytes)/1024/1024 AS free_mb
            FROM dba_free_space GROUP BY tablespace_name) fs
       ON df.tablespace_name = fs.tablespace_name;
COMMIT;
Step 3 — fit a line, get days-to-full
Now the elegant part. Oracle's REGR_SLOPE analytic function fits a least-squares line to your points and returns the slope — here, MB grown per day. Divide the remaining free space by that slope and you have days-to-full:
SELECT tablespace_name,
       ROUND(growth_mb_day, 2)                          AS growth_mb_day,
       ROUND(free_mb)                                  AS free_mb,
       CASE WHEN growth_mb_day > 0
            THEN ROUND(free_mb / growth_mb_day)
            ELSE NULL END                              AS days_to_full
FROM (
  SELECT tablespace_name,
         REGR_SLOPE(used_mb, snap_time - TRUNC(SYSDATE)) AS growth_mb_day,
         MAX(max_mb - used_mb)
             KEEP (DENSE_RANK LAST ORDER BY snap_time)    AS free_mb
  FROM   ts_history
  WHERE  snap_time > SYSDATE - 30          -- last 30 days of trend
  GROUP BY tablespace_name
)
WHERE growth_mb_day > 0
ORDER BY days_to_full;
Two things make this work: REGR_SLOPE(used_mb, snap_time - TRUNC(SYSDATE)) uses date arithmetic so the x-axis is in days, giving a slope in MB/day; and the KEEP (DENSE_RANK LAST ORDER BY snap_time) grabs the latest free space for each tablespace. Sorted ascending, the tablespace about to fill is the first row you see.
What this still doesn't solve
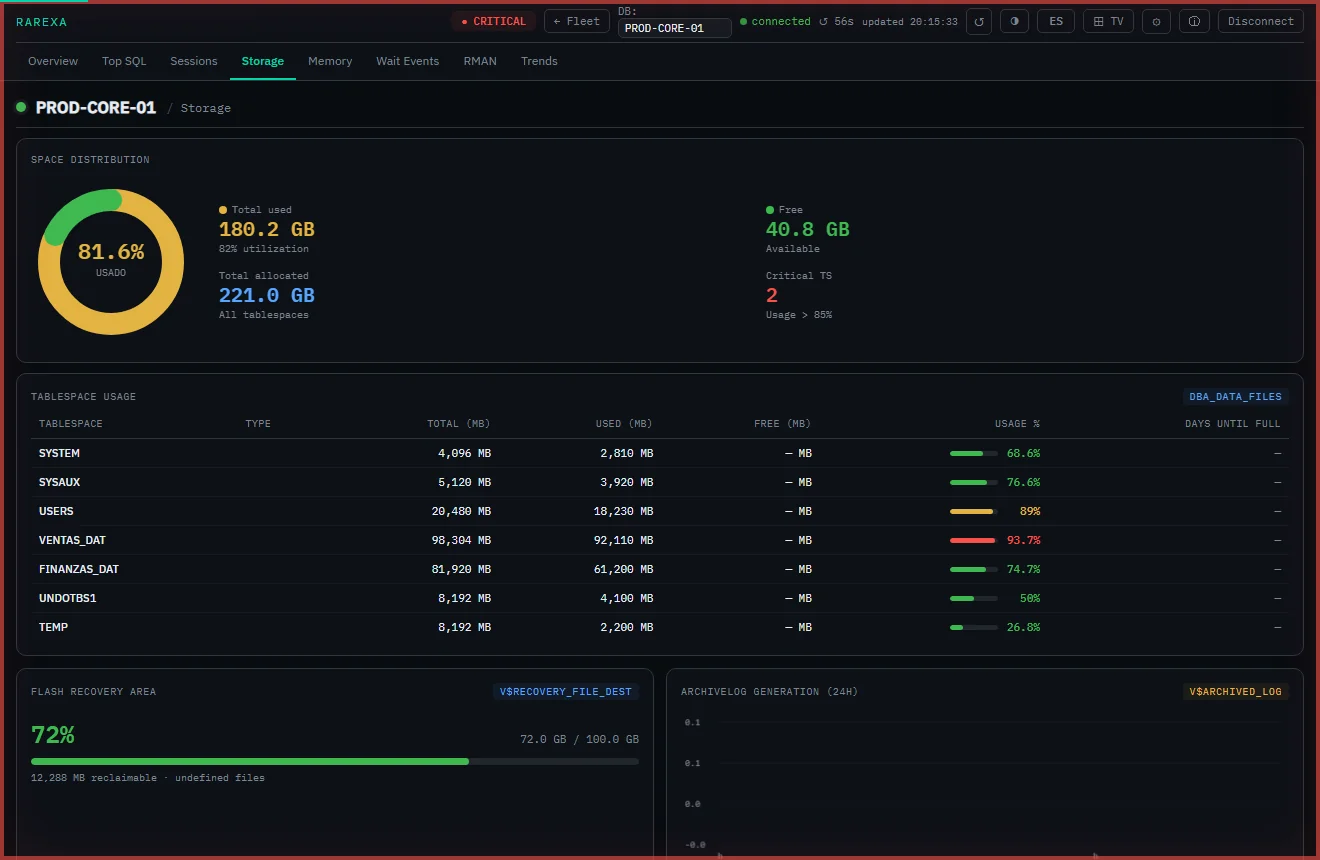
The SQL is the easy 20%. The other 80% is operational: running the snapshot reliably on every database, retaining and rolling up history so the table doesn't bloat, visualising the trend, and alerting when days-to-full drops below, say, 14 — per database, with thresholds you can tune. That's a monitoring product, and it's exactly what Rarexa Oracle Health Dashboard does out of the box: it keeps the history, computes days-to-full per tablespace, and surfaces the ones filling soonest across your whole fleet.
Frequently asked questions
How do I calculate days-to-full for an Oracle tablespace?
Does Oracle store tablespace growth history?
What growth window should I use for the forecast?
Capacity forecasting, built in
Rarexa keeps the growth history and shows days-to-full per tablespace automatically. Free 15-day trial.
Download the trial