How to monitor Oracle tablespaces without Enterprise Manager
A full tablespace will stop your application cold — and it always seems to happen at the worst time. The good news: everything you need to watch tablespaces lives in two always-licensed views, DBA_DATA_FILES and DBA_FREE_SPACE. No Enterprise Manager, no Diagnostic Pack. Here are the queries that actually get it right.
The mistake most "tablespace full" queries make
The naive query compares used space to currently allocated space. But if your datafiles are autoextensible, a tablespace at "98% used" might have gigabytes of headroom left — it just hasn't grown into them yet. Conversely, a non-autoextend tablespace at 98% is a genuine emergency. To get a real answer you have to measure against the maximum size each datafile can reach.
The query: real usage vs. the autoextend ceiling
This reports each permanent tablespace's allocated size, used size, free space, and — the number that matters — percent used against the maximum it can grow to:
SELECT df.tablespace_name,
       ROUND(df.alloc_mb, 1)                        AS alloc_mb,
       ROUND(df.alloc_mb - NVL(fs.free_mb,0), 1)   AS used_mb,
       ROUND(NVL(fs.free_mb,0), 1)                AS free_mb,
       ROUND(df.max_mb, 1)                          AS max_mb,
       ROUND((df.alloc_mb - NVL(fs.free_mb,0)) / df.max_mb * 100, 1) AS pct_used_max
FROM   (SELECT tablespace_name,
               SUM(bytes)/1024/1024 AS alloc_mb,
               SUM(GREATEST(bytes,
                   DECODE(autoextensible,'YES',maxbytes,bytes)))/1024/1024 AS max_mb
        FROM dba_data_files
        GROUP BY tablespace_name) df
LEFT JOIN (SELECT tablespace_name, SUM(bytes)/1024/1024 AS free_mb
            FROM dba_free_space
            GROUP BY tablespace_name) fs
       ON df.tablespace_name = fs.tablespace_name
ORDER BY pct_used_max DESC;
The GREATEST(bytes, DECODE(autoextensible,'YES',maxbytes,bytes)) trick is the key: for an autoextend datafile it uses MAXBYTES (the ceiling), and for a fixed datafile it uses the current size. Sort by pct_used_max and the tablespaces that can actually run out float to the top.
AUTOEXTEND ON MAXSIZE UNLIMITED reports a huge maxbytes, so its percentage looks tiny — but it can still exhaust the underlying filesystem or ASM disk group. Always monitor OS/ASM free space alongside this query.Don't forget TEMP and UNDO
Temporary tablespaces don't appear in DBA_FREE_SPACE the same way. Use the temp-specific views:
SELECT tablespace_name,
       ROUND(tablespace_size/1024/1024,1)       AS size_mb,
       ROUND(allocated_space/1024/1024,1)      AS used_mb,
       ROUND(free_space/1024/1024,1)           AS free_mb
FROM   dba_temp_free_space;
Turn it into an alert
A query you run by hand is not monitoring — it's a fire drill you have to remember to start. To make it useful, wrap it so it only returns problems:
-- Anything that will be over 90% of its ceiling
SELECT tablespace_name, pct_used_max
FROM   ( /* the query above, as an inline view */ )
WHERE  pct_used_max > 90
ORDER BY pct_used_max DESC;
Then schedule it (DBMS_SCHEDULER, cron, your monitoring stack) and route non-empty results to email or chat. The hard parts aren't the SQL — they're doing this for every database, keeping history so you can see trends, and not waking people for tablespaces that autoextend happily.
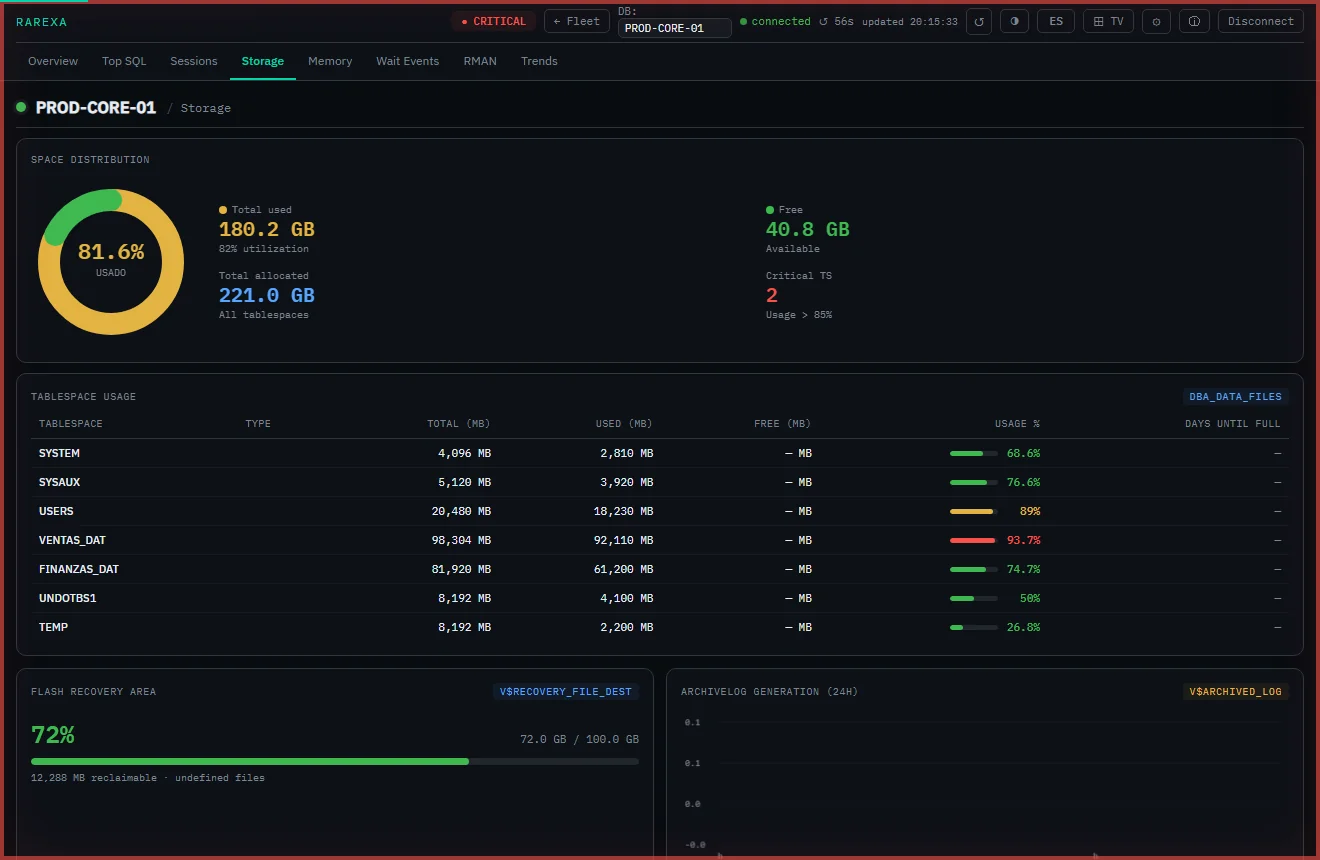
From query to continuous monitoring
If you only manage a couple of databases, the queries above plus a scheduled job will serve you well. Past that, you want history (to compute days-to-full), per-database thresholds, and one screen for everything. That's the whole point of Rarexa Oracle Health Dashboard: it runs exactly this class of read-only query against your databases and turns it into live bars, forecasts and alerts — no Enterprise Manager required.
Frequently asked questions
Which view shows Oracle tablespace usage?
How do I account for autoextend when monitoring tablespaces?
Can I monitor tablespaces without the Diagnostic Pack?
Tablespace monitoring, done for you
Per-tablespace usage, autoextend-aware, with days-to-full and alerts. Free 15-day trial.
Download the trial